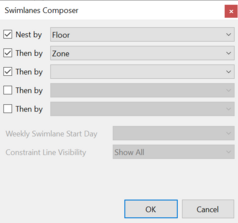
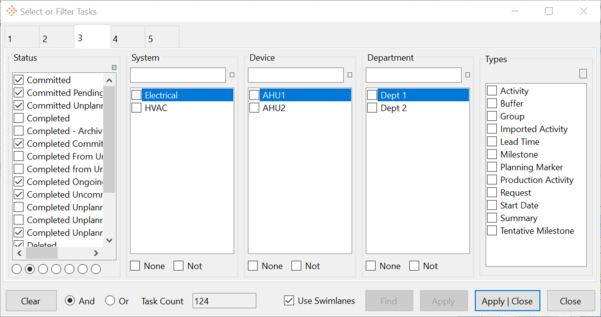
The Gantt Report is a summary report that you can use to roll up workplan summary or report on a lookahead. You will first see a filter dialog to select which tasks to include (if you would like to calculate Percent Complete, make sure to include completed tasks). Then you will see the swimlanes dialog to define how to roll up the information. You can use the Gantt report menu items to customize the options of how the tasks are displayed and to adjust the items in the timeline bar to include Days, Weeks, or Months.
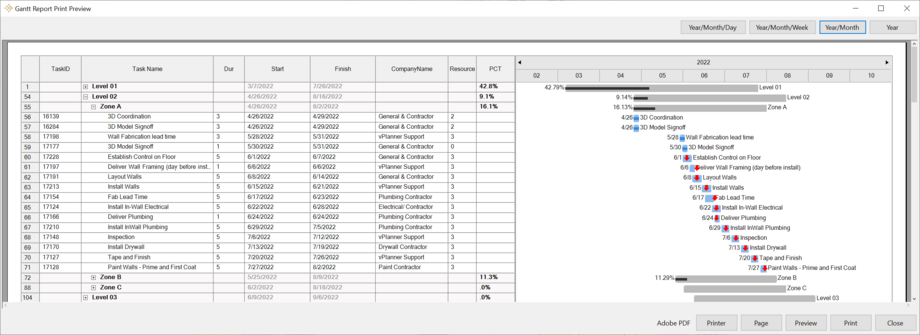
Summary bars are displayed in gray color. Detailed tasks are displayed in blue. The darker color inside the task bar or the summary bar indicated percent complete.
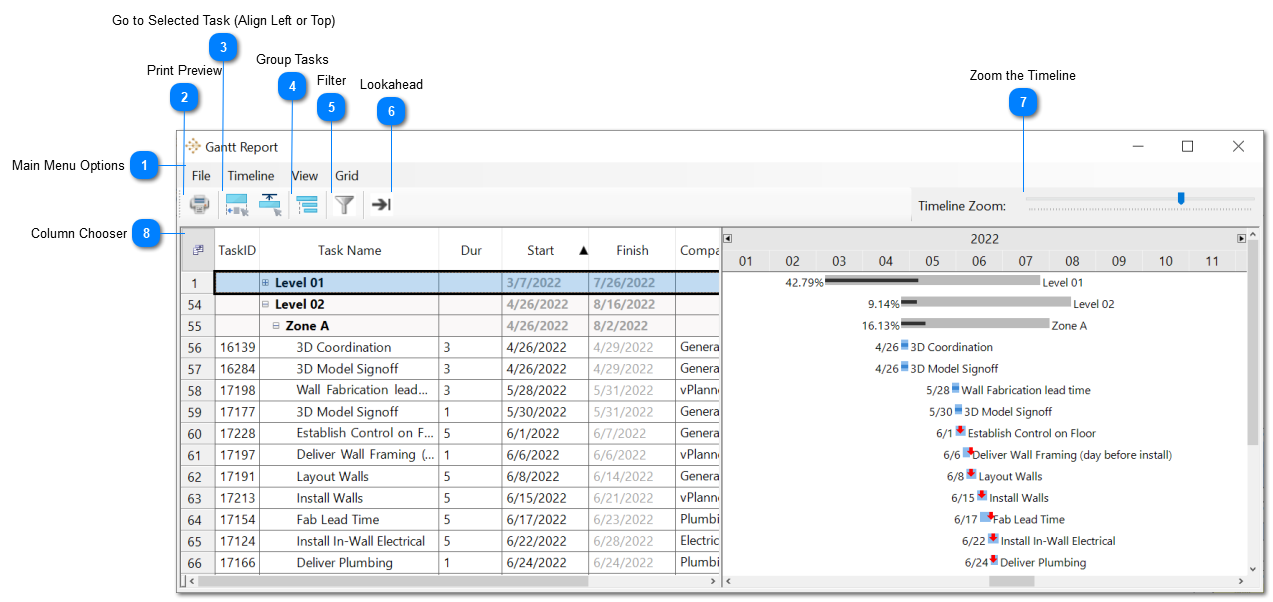 The Gantt Report Dialog
Gantt Report Metrics
Percent Complete (PC): this is the percentage that is displayed on the left side of the summary bar. PC = Sum Completed Durations / Total Durations
Percent Complete Target (PCT) is the target percent complete. PCT = (Sum of Completed Duration + Sum of should have been Completed Durations) / Total Durations.
When PC is lower than PCT the plan is likely behind schedule.
Features and Tools
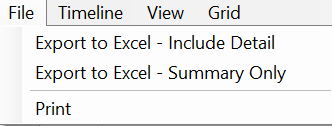
 Main Menu OptionsYou will see the following options under the file menu. You can export the Grid section values to an excel sheet and include all groups and detailed tasks or just the groups.
|
 Print PreviewThe print preview dialog will provide options to select the printer and set the page settings (bottom right).
If the Grid and the Timeline do not fit your page size, you can click on the buttons on the Upper-Right to change the timeline scale (Use Year for very long duration schedule, or Year/Month). The timeline will scale automatically to fit the page if there is room to display all the columns. If it still does not fit the page, try Lanscape orientation or a larger paper option. The settings try to optimize for a legible print size for the text on paper.
|
 Go to Selected Task (Align Left or Top)Select a row in the grid and click either button to focus on that task by aligning the timeline to fit the task to the left or the top of the timeline section.
|
 Group TasksThe group dialog allows you to change the grouping of the visible tasks in the timeline.
|
 FilterThe filter dialog will allow you change the number of tasks displayed in the timeline based on the options you select in the filter.
|
 LookaheadThe Lookahead dialog will enable you to display tasks that fit a specific date range in the future as well as to filter by team, company or any custom filter. You can use the Lookahead to distribute a lookahead report as a gantt chart.
|
 Zoom the TimelineUse the slider to change the zoom level of the timeline section.
|
 Column ChooserUse the column chooser to select which columns are visible or hidden in the Grid section.
|

